Welcome to New Hampshire Climate Audit

It seems to have become self-evident with climate science issues that you can make any claim regardless of what the data shows, as long as you do not have to release the data. At some point, this will be exposed by someone who will understand the significance of what certain people have done to science.
What is happening to our climate in New Hampshire? This site gives an analysis of temperature data from The National Oceanic and Atmospheric Administration (NOAA) for the past 113 years. The first year of the analysis was 1895 and the last year was 2008,  any data for 2009 will be shown in the monthly graphs as they become available and not in the annual graphs until all months for the year are available.

Latest Updates

The annual data has been updated for the year 2008.

The Monthly Trends page available here is current to December, 2008.


The last 113 years - Updated for the year 2008

The NOAA data is complete in that it did not skip any years, we tried to analyze data from other sources but found data files that were corrupt and could not be viewed.
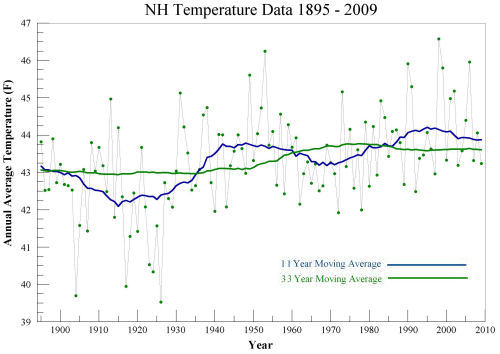
If you look at the graph below the straight blue line shows the calculated Trend Line. No surprises here, it's been warming. The calculated difference is an average annual change of +1.94°F degrees over the past 113 years.
Note on Preliminary and Final NOAA Data: The information presented here is based on preliminary NOAA data for the final months of 2008. It has been taking up to 3 months before the final monthly temperatures are posted. At this time (late February) the final numbers for November and December 2008 have not been posted.

New Hampshire Temperature Data 1895 - 2008


The last 11 years

Now we hear in the news that some sources say that their has not been any warming for almost ten years. An 11 year trend period is not typical for climate analysis, for example, NOAA publishes climate summaries for cities in the USA based on 30 year periods. So here is where we could be accused of biased data selection however, we only want to see what has been happening over the past 11 years in New Hampshire.

New Hampshire Temperature Data 1997 - 2008

Well now it certainly looks like we have not had any increase in average annual temperature for the past eleven years, it has actually change by -1.75°F.

Moving Average

We are also told that the annual temperatures can run in cycles so lets plot the data with a time series moving average.

New Hampshire Temperature Moving Average Plot 1895-2008

Sure looks like we have a couple of cycles here. Also notice that the tail end of the latest data shows a down trend like the trend of the past 11 years from the previous graph.

Temperature and CO2

Now the some people tells us that the warming is caused by CO2, if this is true then we should see a correlation in a plot of temperature and CO2. The data we found available for CO2 goes back to 1959 so we took the available data from NOAA and produced two plots, one we call the short term of ten years and the other is full term of 49 years.

Here is the graph of temperature, temperature trend and CO2 for the past 49 years.

Temperature and Co2 last 49 years

Looks like a good correlation for the past 49 years. Now let's look at the short term trend of the last 10 years.

Temperature and CO2 last 10 years

Well now it looks like we do not have any correlation and a possible negative correlation. Kind of makes us suspicious of the claimed major cause of global warming.
For a good analysis of CO2 and global warming check this link out.

So now we go onto the next question, is the warming of the past 113 spread evenly over the year or is it seasonal?
To answer this question we have to look at the monthly trends.

Definitions

Links

Contact Us